
Graphical Representation of Cumulative Frequency Distribution
Graphical Representation of Cumulative Frequency Distribution: Overview
This topic covers concepts, such as, Ogive: Cumulative Frequency Curve, Cumulative Frequency Curve of Less than Type, Cumulative Frequency Curve of More than Type, Relation between Ogives and Median & Finding Median through Ogives etc.
Important Questions on Graphical Representation of Cumulative Frequency Distribution
For a given data with observations, the 'less than ogive' and the 'more than ogive' intersect at . The median of the data is . Then, the value of and are
The monthly consumption of electricity (in units) of some families of a locality is given in the following frequency distribution:
A 'more than type' ogive is plotted for this data as
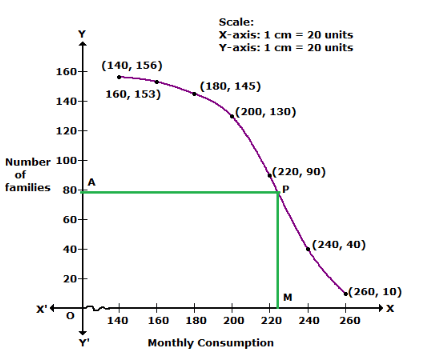
The median for the given frequency distribution is represented by
The heights of girls of Class of a school are recorded as follows.
A 'more than type' ogive for the above data is
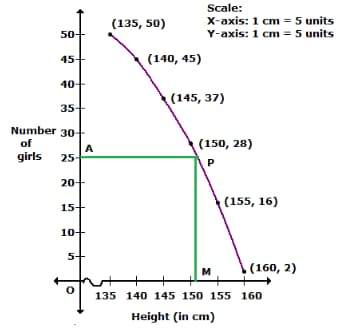
The median is
For a given data with observations the 'Less than ogive' and the 'more than ogive' intersect at . The median of the data is _____.
The heights of students are measured. The results have been used to draw this cumulative frequency diagram. 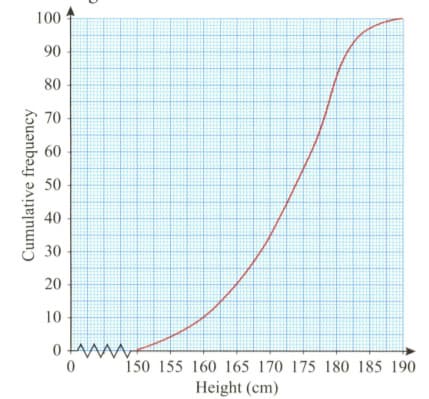
Find the number of students with a height greater than .
This cumulative frequency curve shows the masses of
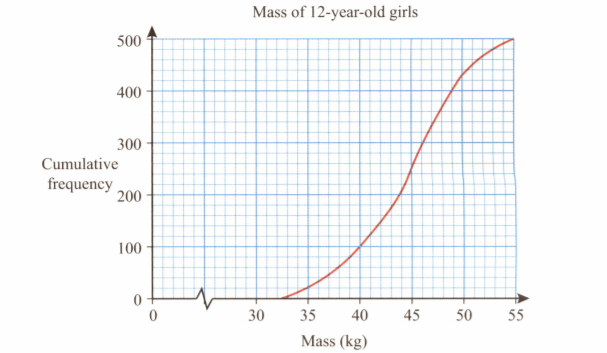
How many girls have a mass between
Which of the following cannot be determined graphically?
If ogive is a _____ curve, then it must be more than type ogive. (constant / falling / rising)
If the 'less than type' ogive and 'more than type' ogive intersect each other at then the median of the given data is
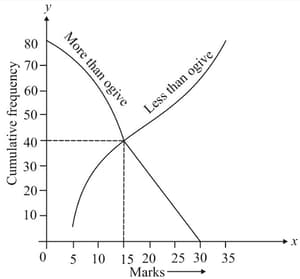
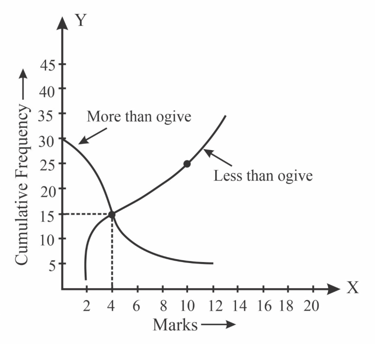
In the below figure the value of the median of the data using the graph of less than ogive and more than ogive is
The abscissa of the point of intersection of 'Less than' and 'More than' type cumulative frequency curves of a grouped data gives its
An ogive is the same as frequency polygon.
In the 'less than' type of ogive the cumulative frequency is plotted against
What is the value of the median of the data using the graph in the following figure of less than ogive and more than ogive?
For a given data with observations the 'Less than ogive' and the 'more than ogive' intersect at . The median of the data is:
The median of a frequency distribution is found graphically with the help of
Two ogives, 'less than' type and 'more than' type of the same data intersect at the point . The _____ of this point represents half of total frequency.
The abscissa of the point of intersection of the less than type and of the more than type cumulative frequency curves of a grouped data gives its
Intersection of less than Ogive and more than Ogive gives Median.
In More than Ogive curve, cumulative frequencies are marked against the lower limit of the respective classes.


